Tools for Real-Time Visualizations and Analysis of Large Datasets
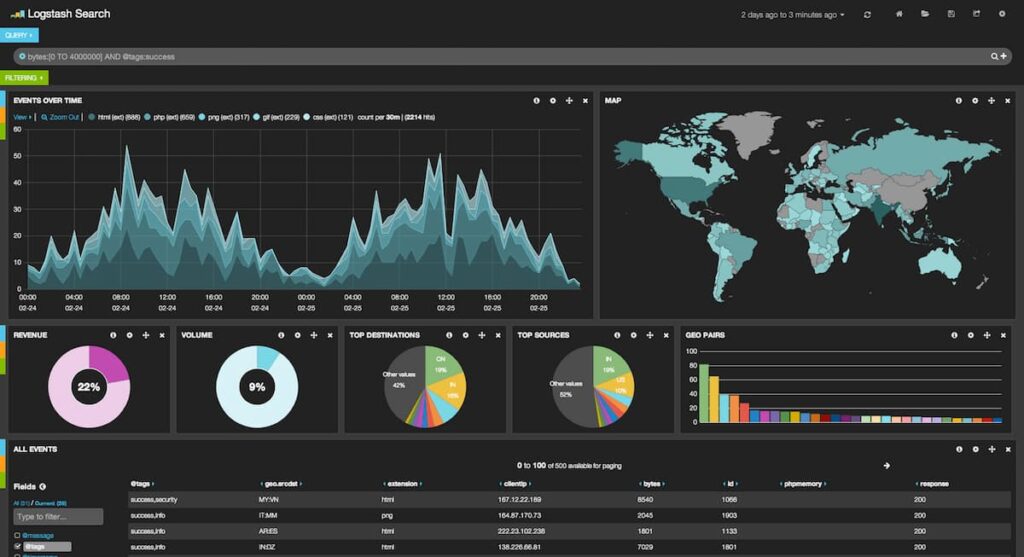
While Elasticsearch is primarily used as a search engine, the platform has recently become more widely used in a variety of analytics tasks, including the ELK Stack of Elasticsearch, Logstash, and Kibana for real time analysis of large datasets. Elasticsearch also shows great potential in the realm of IoT, in which hundreds of data sources must be monitored in real time. Through optimized searching of time series data, Elasticsearch can be integrated with RESTful web services such as Spring Boot to provide users with real time visualizations of their sensor data.
We have begun to experiment with Elasticsearch, Spring Boot and DC.js to provide dynamic time series visualizations. With the use of Elasticsearch aggregations, we may dynamically query time series data at a minute, hour, or daily basis depending on the user’s requested timespan. Depending on the span, different aggregation levels will be triggered, scaling to ensure the queried data is not excessively fine-grained.
What We Did
In the following example, data was generated to simulate the readings of temperature sensors in a restaurant environment. These were taken from a PostgreSQL database, formatted, and posted in bulk to an Elasticsearch server. From there, a Spring Boot project was created to connect to, post and query from an Elasticsearch server. Our Elasticsearch server contained four fields: the sensor id, name, reading, and timestamp. With these fields, we built aggregation queries that specify the requested sensor, timeframe, and precision, aggregating the average sensor reading by minute, hour, or day.
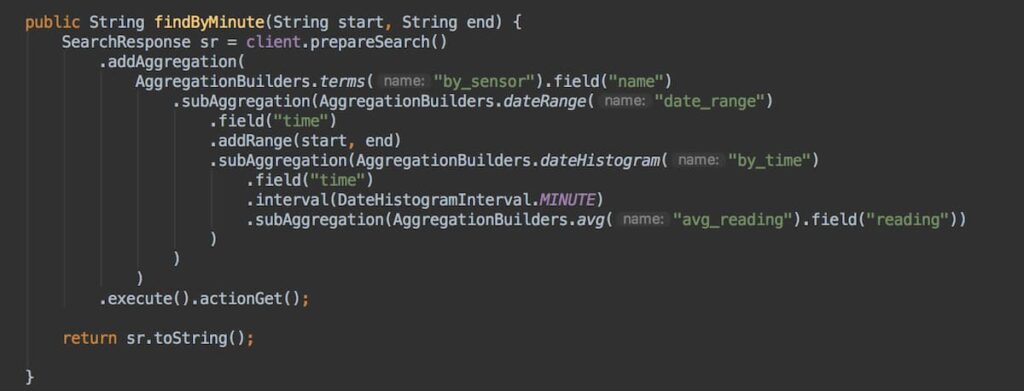
In this example, the user wishes to select specific temperature sensor and time range, and view a time plot of readings over the selected range. Using the Elasticsearch aggregations Java API, we can construct a four level aggregation, composed of a terms aggregation specifying the sensor name, the time range, a time histogram aggregation specifying the time granularity, and an average aggregation to return the average temperature over each timestep. Separate time aggregations are mapped to different functions in the Spring Boot service.
An early challenge we faced was properly defining the node client in Spring to query Elasticsearch. Following Mkyong’s tutorial for connecting to an Elasticsearch cluster using Spring Boot, we defined an Elasticsearch client in our configuration file as a bean, and autowired it into the sensor services file where our querying and aggregation functions were defined. The Elasticsearch host, port, and name were defined in the application properties file. With this set up properly, we were able to define bucket aggregations such as the following:
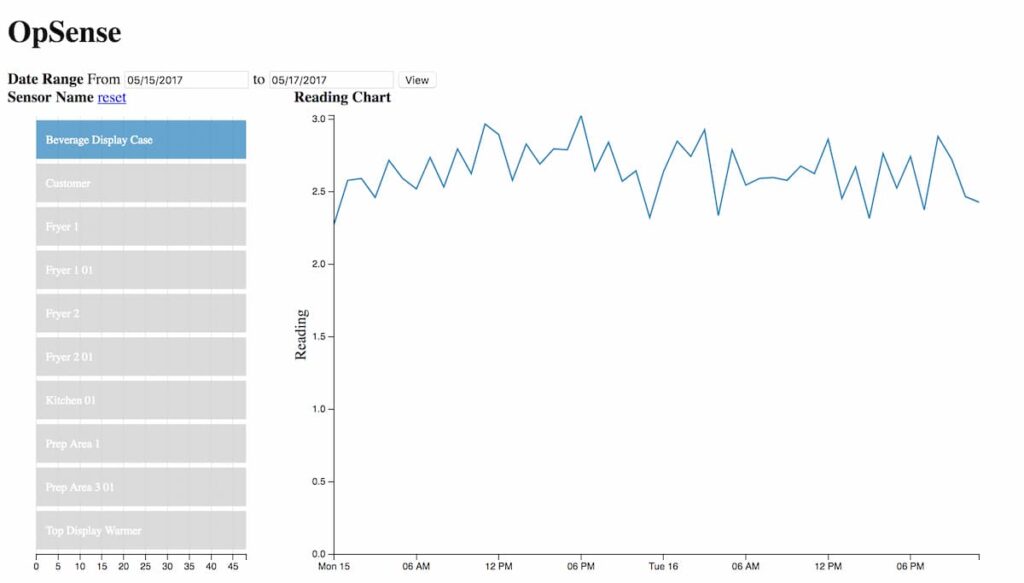
For visualizations, we utilized DC.js, a javascript library allowing users to quickly filter through multi-dimensional datasets. Time frames may be selected using widgets such as Datepicker, while moment.js may be used to calculate the selected timespan. This timespan can then be used to dynamically display data at an optimal time aggregation, where the Spring Boot controller is passed the time range and conditionally selects the best aggregation function to return the data. This data may then be converted into JSON format and posted to an HTTP address.
Findings
While it may not seem directly related to IoT monitoring, Elasticsearch has proven very effective in improving query times. Through a number of underlying optimizations for retrieving time-series data, Elasticsearch may be integrated with a RESTful framework to provide accurate and high-speed visualizations for users. The use of aggregations prevents users from querying and visualizing too many data points by dynamically adjusting the data’s time granularity.
Looking forward, we aim to integrate our Elasticsearch research with non-simulated sensor data, building a full data pipeline from real-time sensor readings to visualizations. Additionally, we will continue to iterate our visualization interface to provide the optimal user experience.