
The ability to accurately track customers, equipment, and products in brick-and-mortar locations can give businesses valuable insights in areas like optimal product placement, asset location, and more. But, unfortunately, the value of these insights is often diminished by high deployment costs, inadequate accuracy for the use case, or the data becomes tainted by optional customer participation. This article explores the distance detection accuracy between a low-cost, fixed-asset Bluetooth Low Energy (BLE) beacon and a low-cost BLE receiver.
Fixed-asset BLE tracking beacons are battery-powered sensors attached to equipment or products that move around. They are typically easily replaceable and inexpensive, and they broadcast a wireless signal at a fixed interval to maximize battery life. One or more stationary BLE receivers hear those broadcasted signals and detect how “loud” they are (their strength). Wireless signal strength is measured as RSSI, the received signal strength indicator, and is an estimated measure of how well the receiver can hear the beacon. Using RSSI, we can calculate an estimated distance between the beacon and receiver.
One caveat with using BLE is that it is not very accurate, even in the best conditions. The leading cause of inaccuracy is that BLE operates over the same narrow-band path that WI-FI (2.4 GHz frequency) and other neighboring devices communicate on, much like trying to pick out a single voice in a stadium of screaming fans. This congestion can lead to interference and diffraction. The location’s environment can also impact accuracy. For example, walls, shelves, furniture, and carpet can absorb or interfere with radio signals and influence the detected signal strength.
This article assumes using an example business goal of detecting bascart locations in a theoretical grocery store. Before I suggest equipping bascarts with low-cost BLE beacons, I’d like to understand whether a low-cost BLE solution is suitable for this use case. To do that, I will start by looking at the accuracy of detected distances between one BLE beacon and one BLE receiver.
Most USA-based grocery stores use gondola wall units to display products in aisles. Because those gondola wall units come in standard depths of between 18 and 24 inches, I took the minimum depth, doubled it, and assumed a minimum distance detection accuracy tolerance of one meter. This tolerance should give us enough wiggle room to precisely detect bascarts in an aisle.
Environment and Equipment
Since most of us are WFH, I performed the tests in the most extended area available in my apartment. Eight sets of neighbors surround me, each with WI-FI, cellphones, and various BLE devices. So this setup isn’t ideal and does not mirror the one you’d find in a more controlled environment.
I used the Nordic Thingy:52, with the default settings, as a beacon to transmit a signal once every second – this became the beacon. To read the broadcast beacon signals, I used a Google Pixel 4 XL phone with the Beacon Scanner app – this became the receiver. I utilized BLE 5.0 support on both devices.
Test Process
I placed the beacon (Nordic Thingy:52) in a fixed location at waist height. Then, the receiver (Pixel 4 XL) was moved in half-meter increments away from the beacon, starting at 0.5 meters (about 19.7 inches) and ending at 9.5 meters (about 31.2 feet), along the same horizontal plane with a clear line of sight. At each increment location, 20 RSSI readings spaced one second apart were recorded by the receiver device.
After capturing the actual distance and RSSI readings, I entered those values into a spreadsheet. Then I used the following RSSI distance calculation, obtained from the IoT and Electronics blog, to calculate each reading distance.
Calculated Distance = 10 ^ ((Measured Power - RSSI) / (10 * Environmental Factor))Please note that calculating distances from RSSI readings will typically result in values with a precision of around plus or minus one meter. Furthermore, RSSI values will show a greater degree of variance the further away the radios are from one another.
I exported the actual and calculated distance values to a comma-separated-value (CSV) file. I then used the Python modules pandas, matplotlib, and seaborn to summarize the data and create a box plot series and Excel to create line charts. You can find the captured data, spreadsheets, and Jupyter notebook in my Github repository.
Test Results
The chart below shows a box plot series of the calculated distance quartiles taken at the actual distance in meters. The black diamonds above the individual box plots show outliers. I decided to keep outliers as I would not know which readings were outliers without additional information.
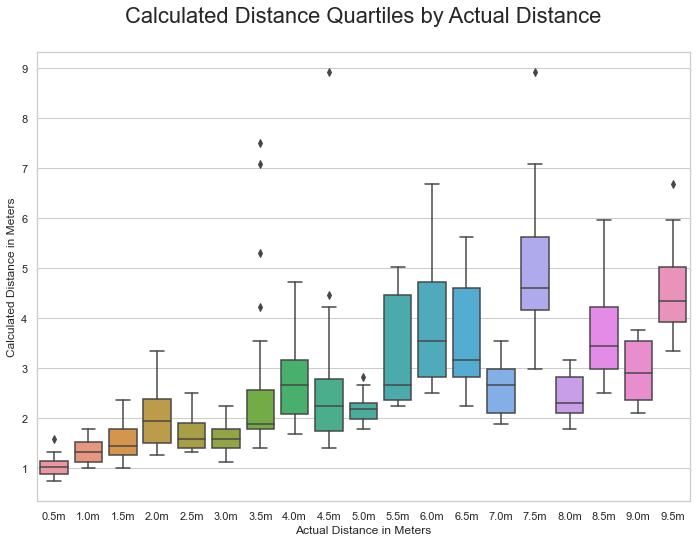
The early readings started within an acceptable tolerance range – from the “0.5m” to “1.5m” actual distance increments – with the variance slightly expanding at each increased iteration. However, after the “2.0m” increment, the readings became more unpredictable.
Let’s look at more detailed charts to see how accurate the RSSI readings are.
Our first detailed chart is the “Min & Max Calculated Distance vs. Actual Distance” line chart. Here, we compare the Actual Distance, Min, and Max column values.
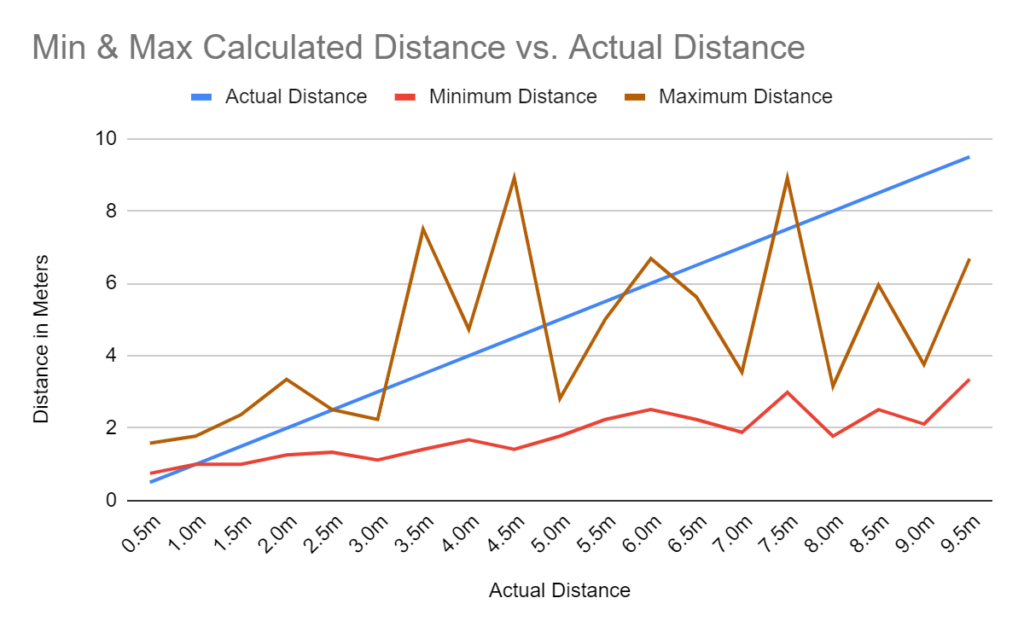
As radios moved further apart, we can see that the minimum calculated distance rate increased less rapidly than the actual distance rate. The maximum calculated distance rate became more unpredictable as the distance increased. The variance between the minimum and maximum is wildly erratic and makes it challenging to obtain an approximate distance within the expected tolerance within a 9.5-meter area.
From this line chart, we can conclude that a single RSSI reading, with the equipment specified and without additional data, does not produce reliable and accurate approximate distances.
Finally, I thought it would be interesting to use the average of all readings taken at each increment. I hypothesized that using these averages would significantly reduce unpredictable values and increase distance detection accuracy. In practice, this process could be accomplished by taking a series of RSSI readings and averaging them based on a fixed time interval or movement. For this analysis, I used the Mean value for each interval I already had to simulate taking a series of RSSI readings and averaging them.
The “Average Calculated Distance vs. Actual Distance” line chart compares the Actual Distance and Mean column values to see how well our averaged reading approach fairs.
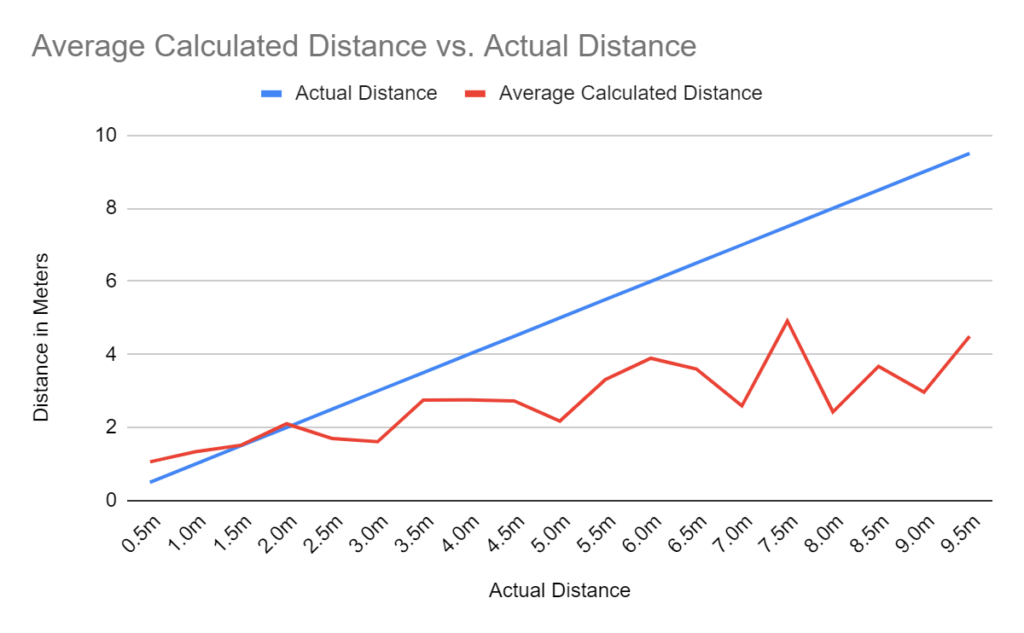
My hypothesis was correct, and we now see significantly lower unpredictability with this approach. But, unfortunately, our calculated distance is still inaccurate. While we see some great accuracy with the readings at “1.5m” and “2.0m”, it looks like the other readings would make it difficult to determine whether the beacon was located at “2.0m”, “3.0m”, “4.0m”, “5.0m”, “7.0m”, or “8.0m” away, given our allowed tolerance.
Let’s visualize the absolute differences between the average calculated and actual distances.
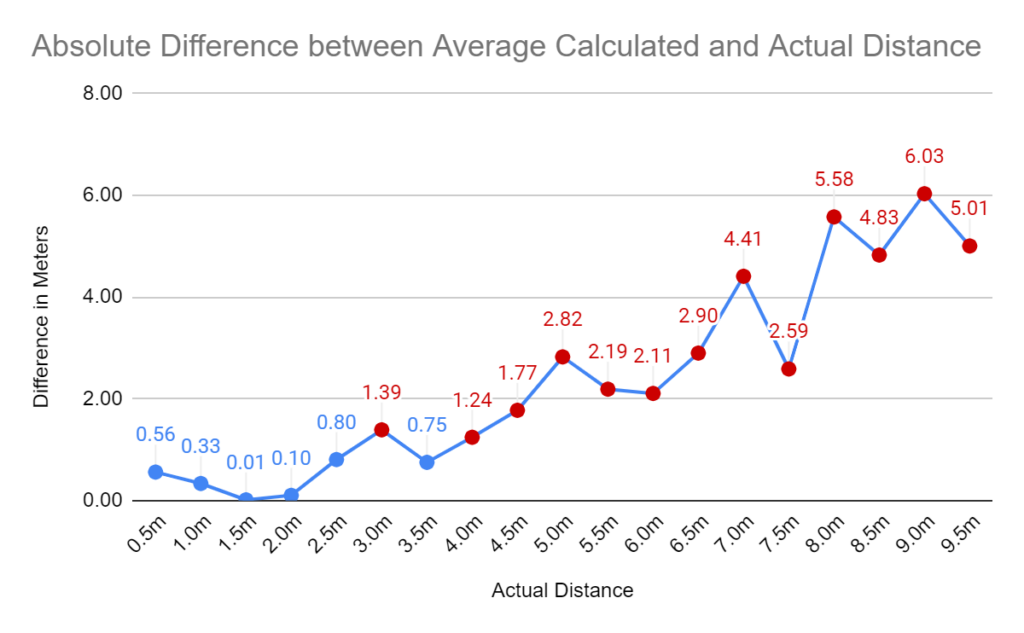
I added labels to make this chart easier to read. Red data points and labels indicate those values were outside of our one-meter tolerance. From this chart, we can see that the differences begin to exceed our tolerance range after the “2.5m” mark. So our data implies that we’d have to place receivers five meters (16.4 feet) apart, assuming placement along the same plane of our bascart beacons.
Placing receivers that close together may not be a practical and cost-effective approach. For example, the average grocery store size is 38,000 square feet, according to Progressive Grocer. A grocery store of that size would require a minimum of 142 receivers (one for every 268.96 square feet) to cover the entire building, assuming we have the same accuracy and placement limitations. The actual number of receivers required would need to be much higher due to the gondola wall units and products on shelves impacting accuracy.
Conclusion
Even though my approach didn’t result in a slam-dunk, I learned a lot about the limitations of using inexpensive BLE devices and RSSI for location tracking. The use of individual RSSI readings from a single-antenna receiver resulted in highly variable distance calculations. My approach of averaging those readings faired much better than single readings, but accuracy beyond 2.5 meters still wasn’t good enough for my use case.
Other approaches would be needed to achieve the desired accuracy.
Specifically for BLE and beacons, a multi-antenna receiver that uses the angle of arrival (AoA) or departure (AoD) methods may provide the accuracy needed. This approach is more expensive than a single-antenna receiver. Alternately, supplementing the RSSI readings with data from accelerometer and gyroscope sensors could give more accurate distances but would negatively impact the beacon’s battery life.
Did you find this topic interesting and have a project in mind? Let’s talk: https://www.missiondata.com/contact/.
About Mission Data:
We’re designers, engineers, and strategists building innovative digital products that transform the way companies do business. Learn more: https://www.missiondata.com.