Mission Data maintains dozens of deployed Rails apps spread across several server installations. With servers spinning up behind load balancers and instances coming and going based on demand, we find that providing developers with access to production server logs to track down issues has become a growing problem.
We needed a centralized logging system that would allow access to the logs from Rails applications for developers without needing access to all servers. One that would allow logs from load balanced servers to be available in one place, with web server access logs and Rails application logs interleaved chronologically. We were looking for a solution that would let the important data in the logs be easily queried without having to resort to text file searching tools like grep.
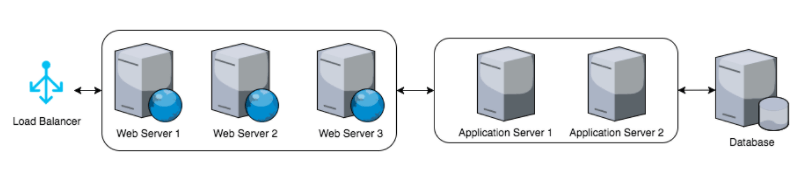
To illustrate the issue imagine our typical stack from the following diagram:
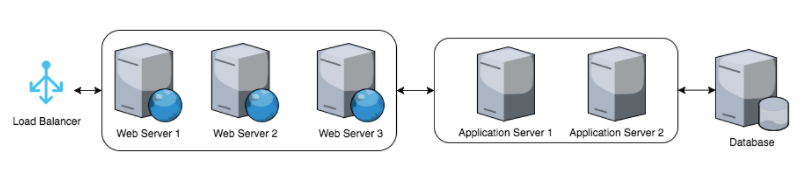
For each step we have at least one set of logs and all together this simple example would have at least 7 different logs. Tracing down an issue quickly become tedious and time consuming when you have to find your way through that many logs and in some cases there are many more logs at play.
The ELK stack
To achieve the goal of centralized, accessible, indexed searching of application and server logs, we decided to try out an ELK stack. ELK is shorthand for 3 tools that work well together to help support central logging and viewing of data: ElasticSearch, Logstash, and Kibana.
ElasticSearch is a document storage service that provides powerful scalable indexed searching capability for documents. It is designed to provide a near real time search over a large amount of data. In the case of collecting and searching Rails logs, a document is a single entry in the log file.
Logstash enables the creation of data pipelines for processing information sent to it from multiple sources or “logs” and filtering the data into a back end “stash”, in this case the ElasticSearch document storage.
Kibana is a web frontend to ElasticSearch. This provides a UI for developers to make use of the logged data using powerful searches and queries.
To make use of the ELK installation, a tool to push data into the Logstash pipeline is required. We settled on Filebeats, a lightweight daemon that runs on each server (shard/instance), monitors changes in log files, and sends new log entries to the Logstash instance running on the ELK server.
The easiest way to get started experimenting with ELK is to find one of the many Docker container instances that are available and run it.
Before trying to send data through the pipeline you first need to get your specific application logs, in our initial case Rails application logs, into a format that can be more readily handled by both Filebeats and Logstash filtering. The logstasher gem worked well for our needs for Rails but there are logging plugins for all sorts of languages and frameworks like node.js, golang, or Java’s log4j to name just a few. The logstasher gem is easy to configure, generates JSON format log output and provides an easy mechanism to add custom fields to the logs. Logstash has built in filters for processing JSON records into an ElasticSearch document. For what we want to achieve, this was far easier than attempting to get native Rails logs processed. Processing Nginx server logs to send to Logstash requires no additional work.
The one part of this setup that took some real trial and error was getting the Logstash filters to work the way we wanted. Everything we needed was supported by the JSON and GROK filters.
Our final Logstash.conf insures that both our Nginx and Rails application logs use the same timestamp field which allows us to see both logs sorted in order using Kibana.
# set logstash beats listening port (must be open to firewall)
# SSL settings for for authorization of incoming Filebeats connections.
input {
 beats {
   port => “5000”
   ssl => true
   ssl_certificate_authorities => [“/etc/logstash/ca.crt”]
   ssl_certificate => “/etc/logstash/server.crt”
   ssl_key => “/etc/logstash/server.key”
   ssl_verify_mode => “force_peer”
 }
}
filter {
 # rails filter expects logstasher gem json format
 if [type] == “app-rails-log” {
   # move filebeats source and fields so they don’t get clobbered by log data
   mutate {
     rename => [ “source”, “[beat][source]” ]
     rename => [ “fields”, “[beat][fields]” ]
   }
   # this automatically uses the json timestamp to be the event timestamp
   json {
     source => “message”
     # removing the original message json string for space
     remove_field => [“message”]
   }
 }
 # nginx access logs
 if [type] == “nginx-access” {
   # move filebeats source and fields so they don’t get clobbered by log data
   mutate {
     rename => [ “source”, “[beat][source]” ]
     rename => [ “fields”, “[beat][fields]” ]
   }
   grok {
     match => { “message” => “%{NGINXACCESS}” }
   }
   # use log timestamp as event timestamp for ES
   date {
     match => [ “timestamp” , “dd/MMM/yyyy:HH:mm:ss Z” ]
   }
 }
}
output {
 # for debugging print each event to stdout.
 stdout {
   codec => rubydebug
 }
 elasticsearch {
   hosts => [ “elasticsearch:9200” ]
   # index is set per filebeats prospector in fields
   # logstashindex : indexname
   index => “%{[beat][fields][logstash_index]}-%{+YYYY.MM.dd}”
 }
}
The Kibana UI takes a bit of experimenting to be able to construct filters and queries on your data that provide value. Here is a simple query that contains what most would consider simple data points to search on but shows the power available for drilling down on just what you are looking for with a single query:
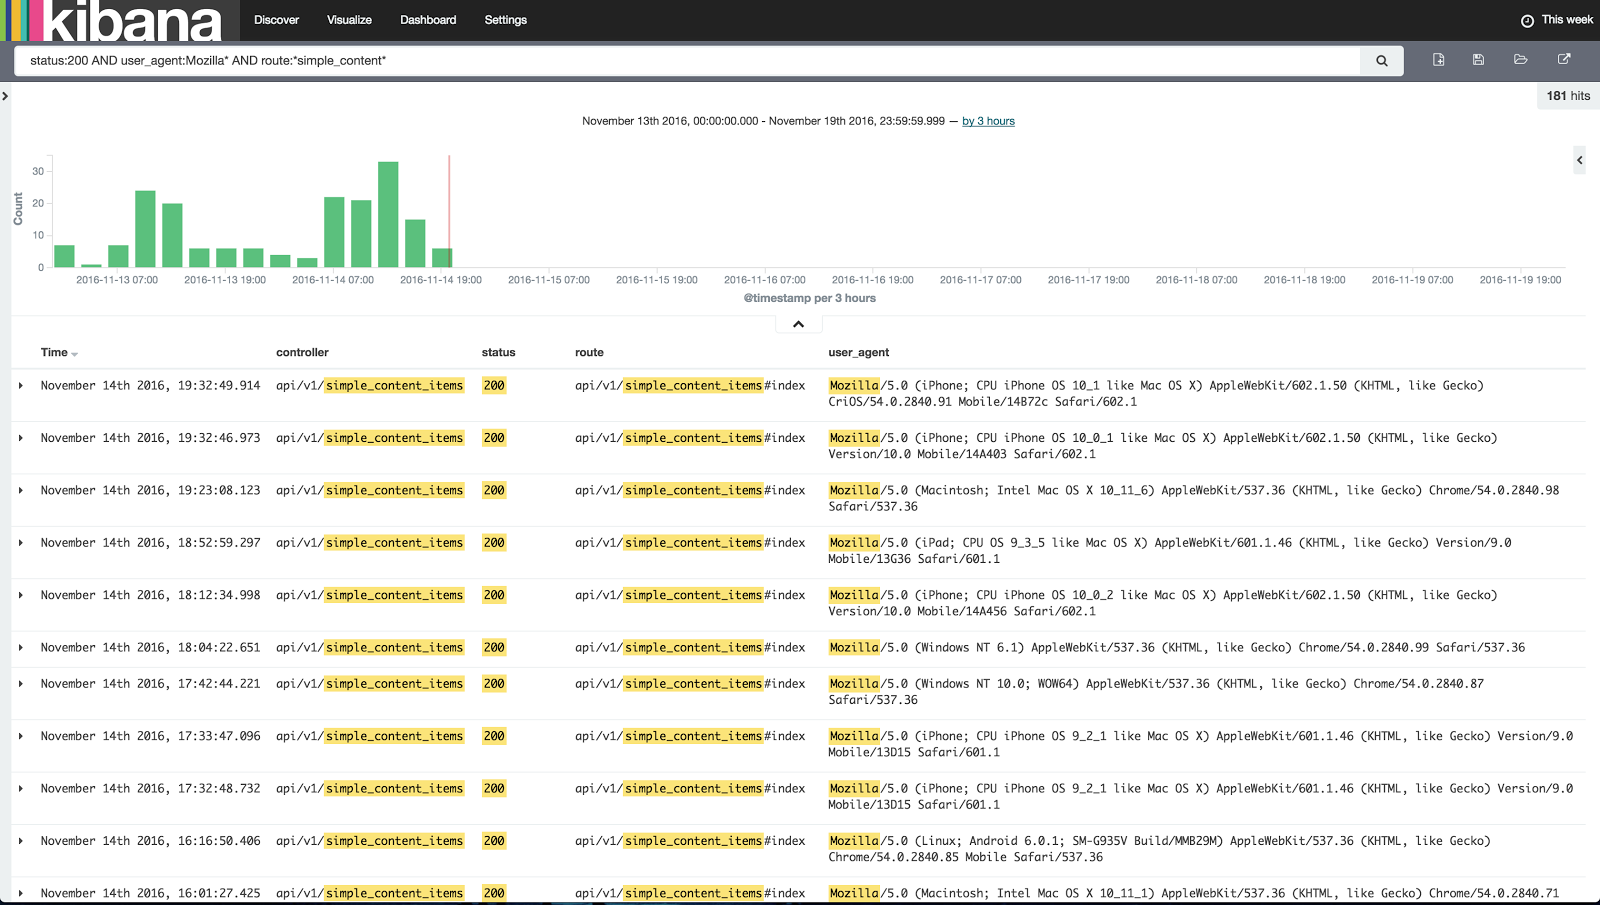
Although not shown here you can also add other fields to the search query above such as user ID, user first/last name, etc and that is something that is far more difficult to extract using grep.
Conclusion
This ELK stack was not particularly difficult to set up and has shown an ability to allow developers to pull interesting information from the log files that would have been difficult to do using traditional text processing tools like grep.
We need to fine tune our stack setup to resolve issues with memory and storage before testing the system under heavier load. Once we do that, we will be able to really tell if the cost of keeping the system running is worth the productivity gains. Bottom line, “so far so good.”